01 — Strengths
Attack and defence, derived
Iterative scaling estimates each team's attack and defence from match history — nothing hardcoded.
TeamAttackDefenceElo
BRABrazil
95
95
ARGArgentina
92
95
FRAFrance
85
88
BELBelgium
82
73
ESPSpain
82
77
GERGermany
85
79
ENGEngland
81
90
CROCroatia
84
77
Attack/defence as 0–100 (percentile), Elo updated chronologically.
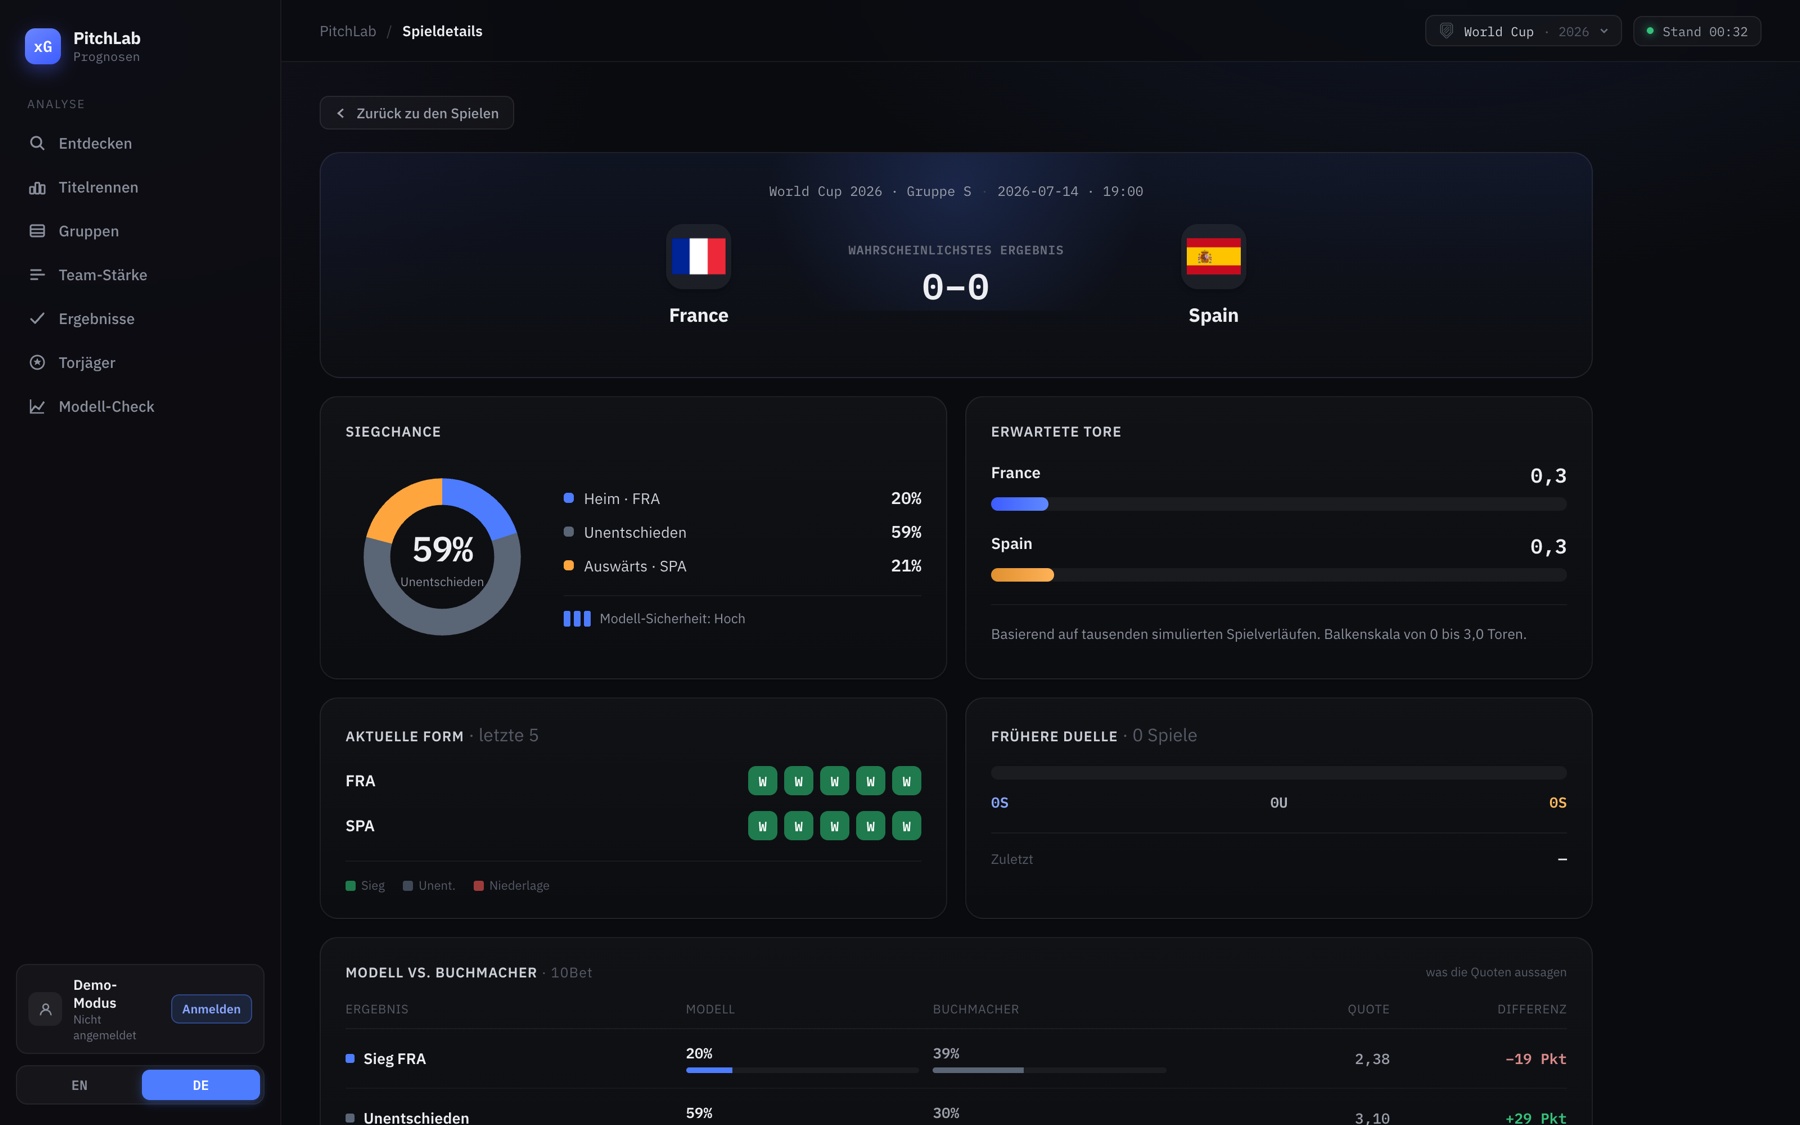
02 — The match model
From two λ to a result
FRAFranceλ 1.72 · 1.13 λSpainESP
Two expected-goal rates give a probability matrix over every scoreline. Dixon-Coles corrects the low scores.
P(i,j) = Pois(i,λ)·Pois(j,μ)·τ(i,j)
FRA 51%Draw 25%ESP 24%
τ (ρ=-0.05) — corrects the dependence in tight scores (0-0, 1-0, 0-1, 1-1).
0
1
2
3
4
5
0
1
1:1
2
3
4
5
FRADrawESP
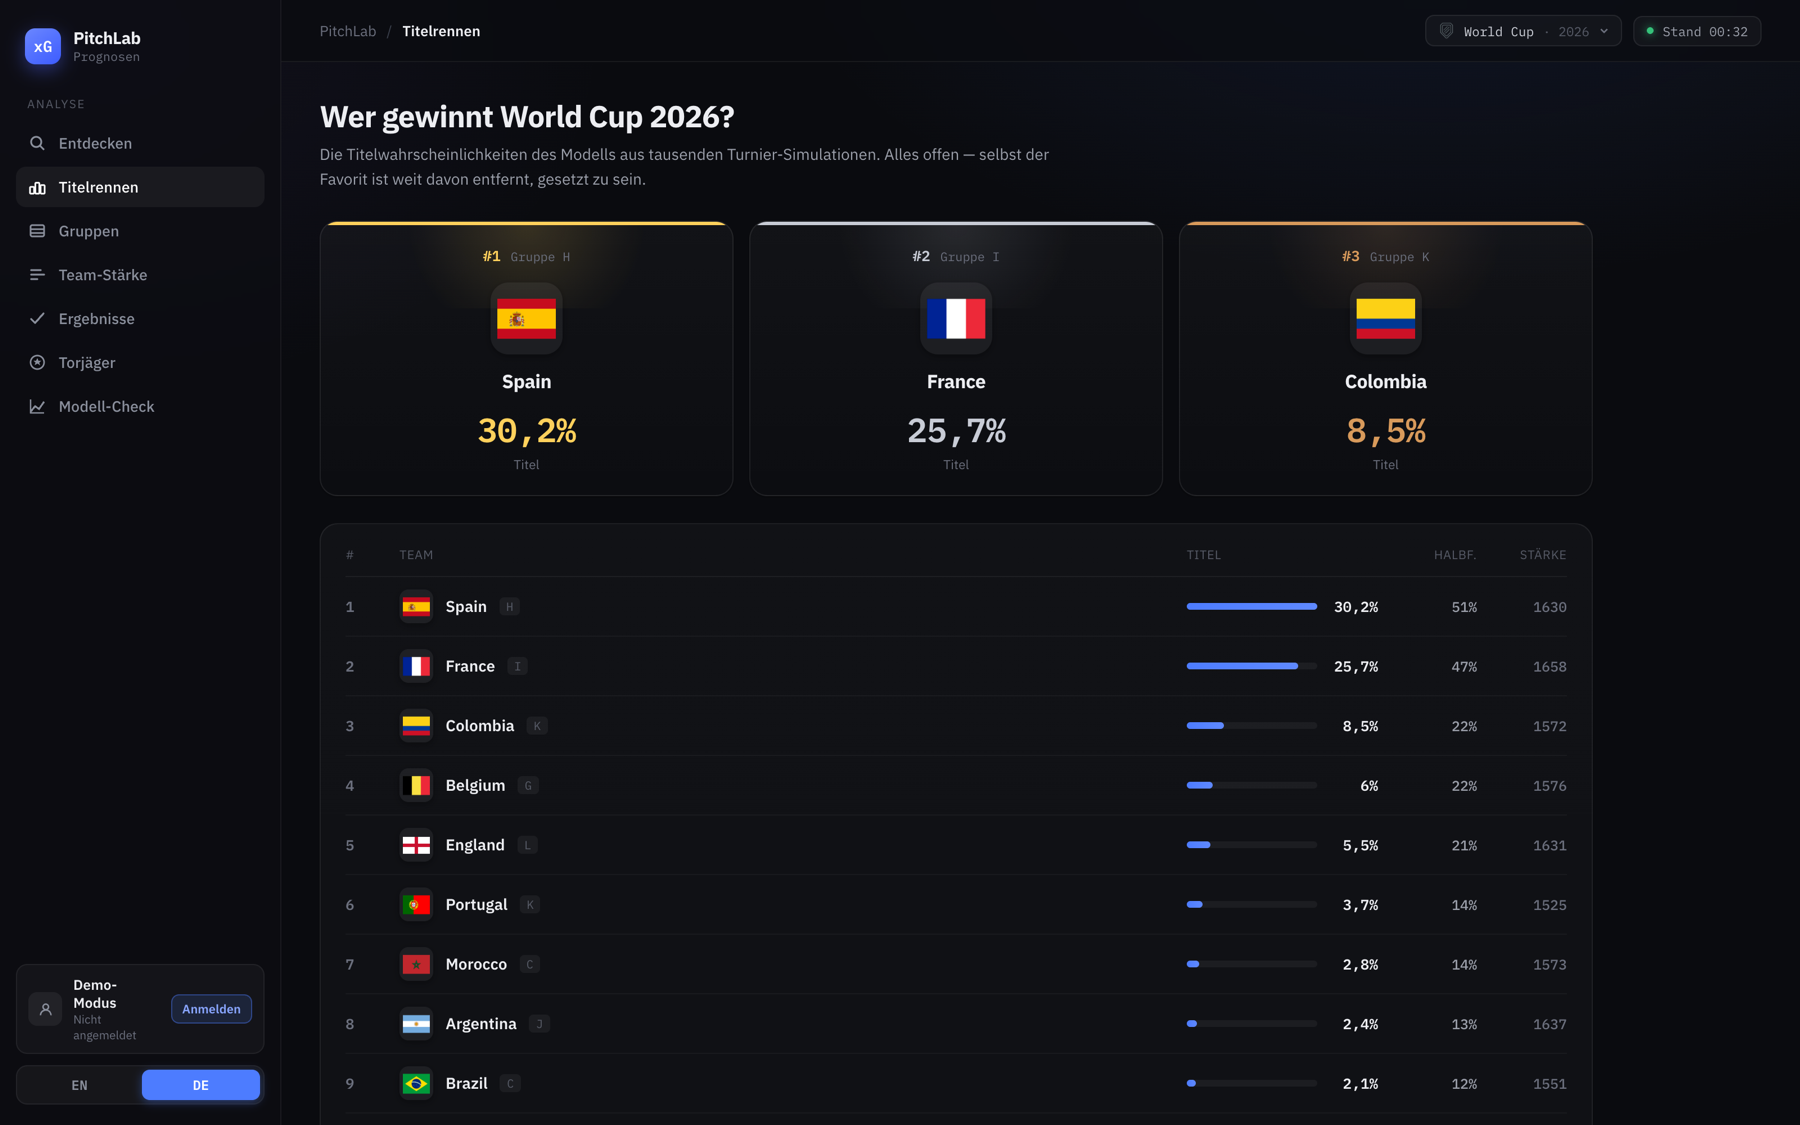
03 — Monte-Carlo
10,000 tournaments, played out
Each run plays out groups and knockouts from the model. Title odds are how often a team wins.
0
Simulations
TeamTitle odds
BRABrazil
0%
ARGArgentina
0%
PORPortugal
0%
FRAFrance
0%
MEXMexico
0%
NGANigeria
0%
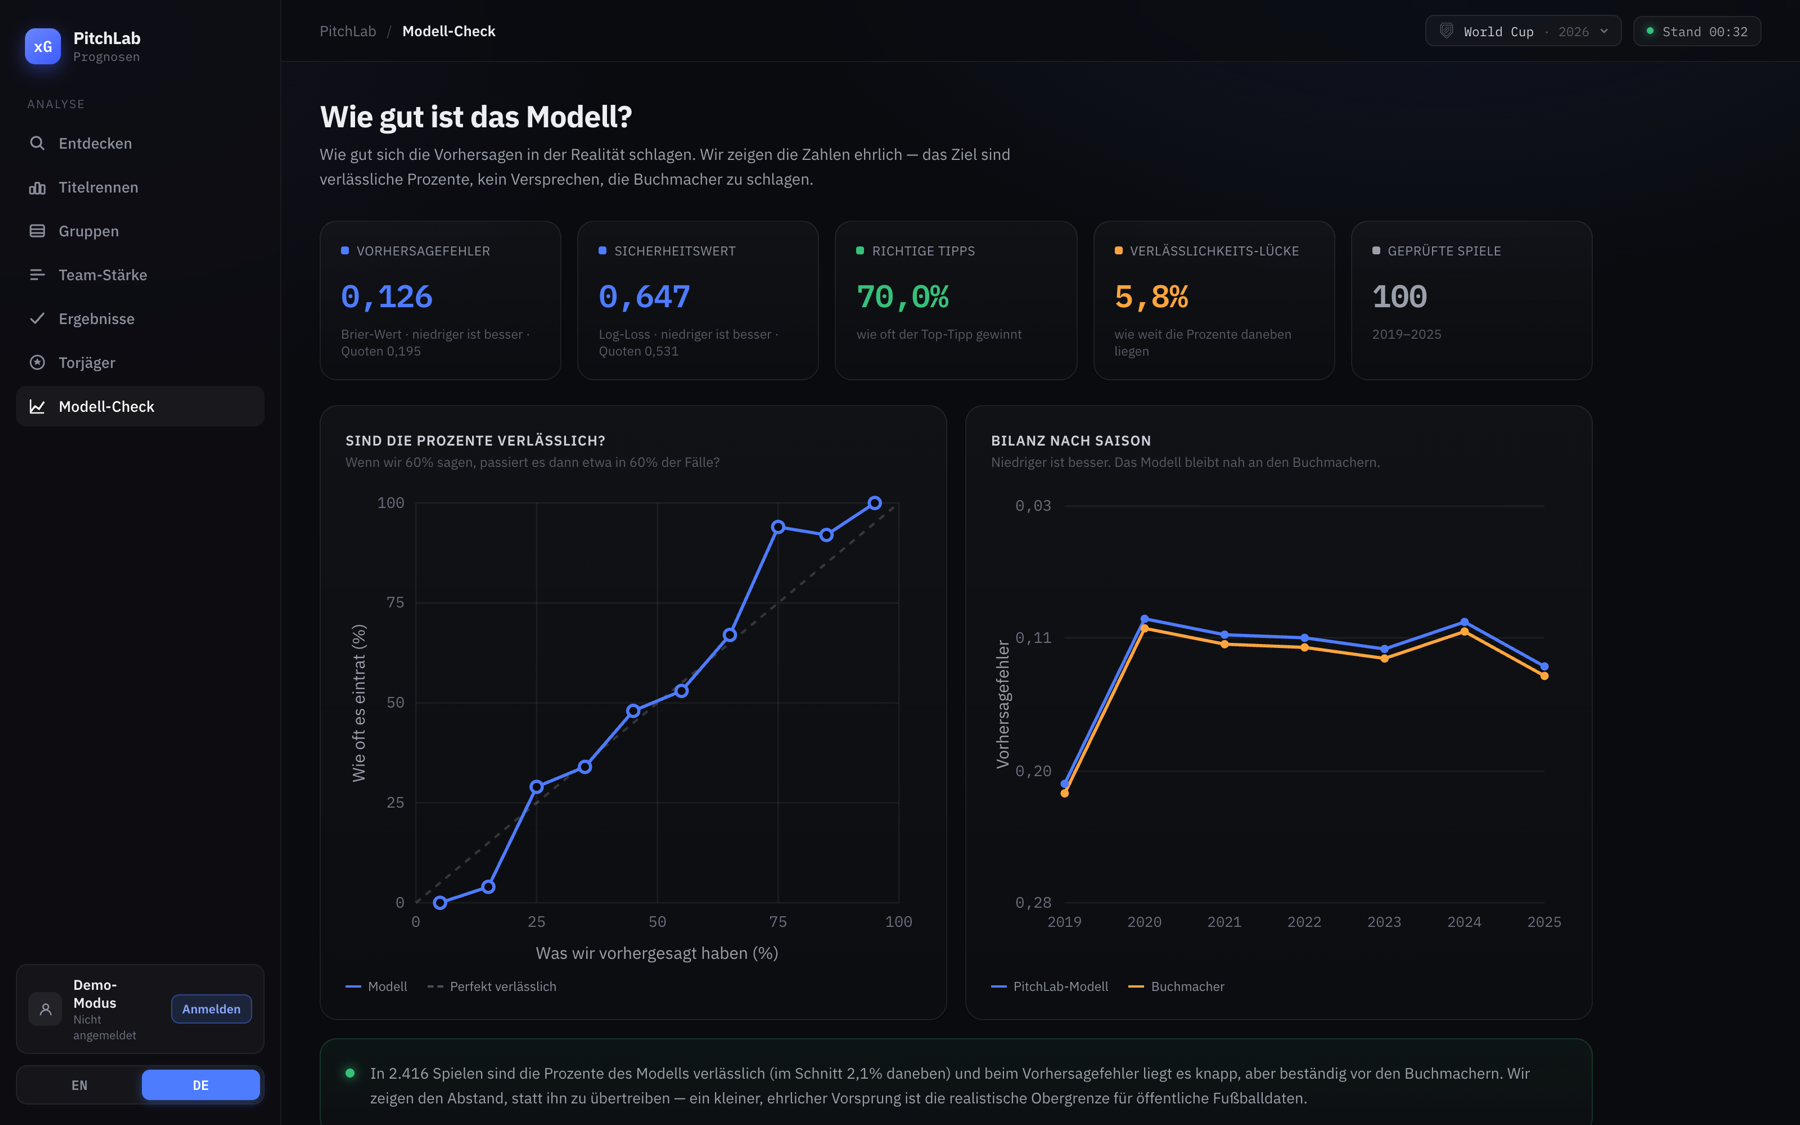
04 — Model check
Predictions that grade themselves
We don't just predict — we measure how well. Calibration, Brier score, and a comparison against a naive market.
Calibration · predicted vs. observed
Predicted %Observed %
Brier per periodModelMarket
2019202020212022202320242025
0.198
Brier score
53.8%
Hit rate
7.8%
Calibration gap
240
Matches checked
05 — The app
The full analysis cockpit
Title race, groups, match analysis and model check — live in demo mode.
pitchlab.projects.manu-web.de
pitchlab.projects.manu-web.de
pitchlab.projects.manu-web.de